Google Opens Up Cloud Monitoring Service to Developers
Featuring full integration of the technology from Google’s acquisition of Stackdriver last year, Google Cloud Monitoring has arrived. It's a tool that developers can leverage to monitor the performance of application components. If you're a Google Cloud Platform customer you can try it out for free beginning immediately. Here are more details.
Eight months ago, Google brought Stackdriver to its bag of technology tols. The company announced Stackdriver’s initial Google Cloud Platform integration at Google I/O in June 2014 and made the service available to a limited set of alpha users. Since then, the team has been working to make operations easier for Google Cloud Platform and Amazon Web Services customers, and hundreds of companies are now using the service for that purpose.
Now, Google has announced the beta availability of Google Cloud Monitoring. All Google Cloud Platform customers can now use Cloud Monitoring to gain insight into the performance, capacity and uptime of Google App Engine, Google Compute Engine, Cloud Pub/Sub, and Cloud SQL.
According to a post on the Google Cloud Platform blog:
"Cloud Monitoring streamlines operations by unifying infrastructure monitoring, system/OS monitoring, service/uptime monitoring, charting and alerting into a simple and powerful hosted service. Customers can use Cloud Monitoring to gain insight into:
- Overall Health: Use resource groups to create aggregate views of your key environments and systems. Incorporate application or business statistics using custom metrics. Create and share custom dashboards to provide your team with a unified perspective.- Usage: Get core metrics and dashboards to understand capacity and utilization of Google Cloud Platform services.
- Uptime: Configure endpoint checks to test functionality and notify team members when web servers, APIs, and other Internet-facing resources become unavailable for end users.
- Performance: View latency, error rates and other key metrics for Google Cloud Platform services, and common web/application serving, database, messaging and load balancing platforms. Configure alerting policies to be notified when metrics are outside of acceptable ranges.
- Incidents: Receive notifications via multiple communication channels when alerting policies are violated.
The new tool lets you configure alerts to notify your team when specified conditions are met, such as when the request latency for your App Engine module exceeds a certain threshold. These alerts can be configured to notify you via email, SMS, PagerDuty, Campfire, Slack, HipChat and webhook.
Finally and very notably, Cloud Monitoring also features native integration with common open source services, such as MySQL, Nginx, Apache, MongoDB, RabbitMQ and many more. For example, you can use our Cassandra plugin to gain deep visibility into the performance of your distributed key value store, as seen here:
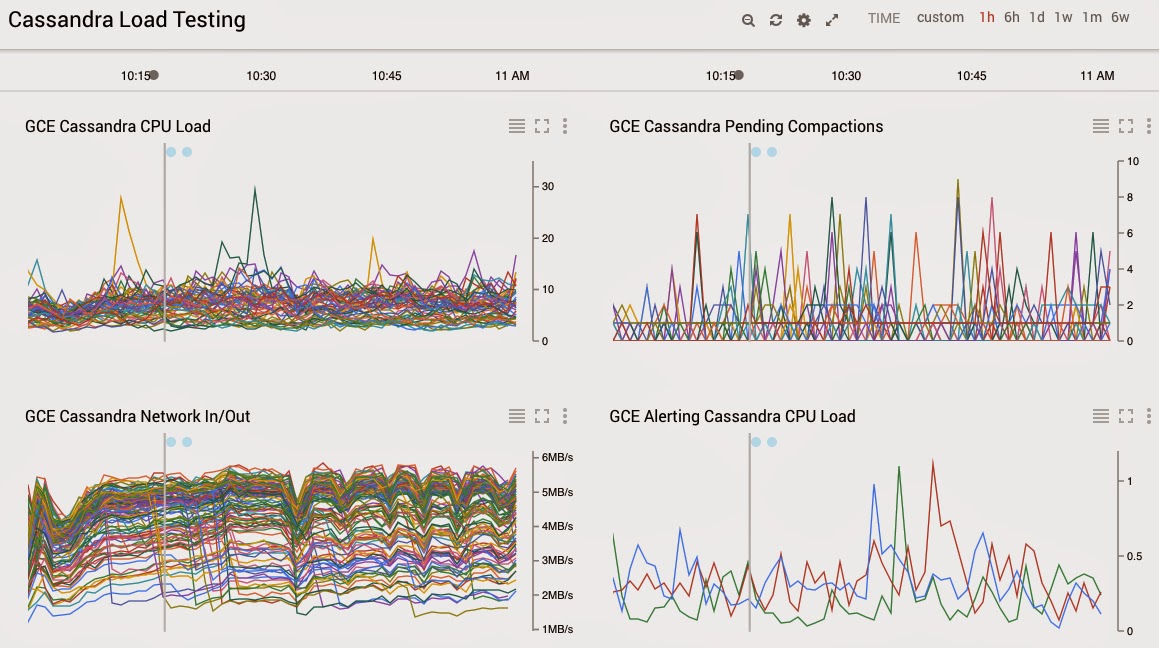